Use a structured Excel template to track gross receipts accurately and avoid errors in financial reporting. A well-designed spreadsheet helps categorize income sources, calculate totals, and generate summaries for quick analysis.
Start with clear column labels for transaction dates, revenue sources, amounts, and payment methods. Use formulas to automate calculations, ensuring totals update dynamically when new data is entered.
To improve readability, apply conditional formatting to highlight discrepancies or overdue payments. Pivot tables can summarize revenue by period, customer, or category, providing deeper insights into financial performance.
Save time with predefined templates that include built-in calculations and formatting. Customizing fields ensures compatibility with tax reporting requirements and accounting software. A structured approach streamlines financial management and reduces manual work.
Summary of Gross Receipts Excel Template
Track income sources accurately by categorizing revenue streams in separate columns. Use clear labels such as “Product Sales,” “Service Fees,” and “Other Income” to simplify reporting.
Automate calculations for accuracy
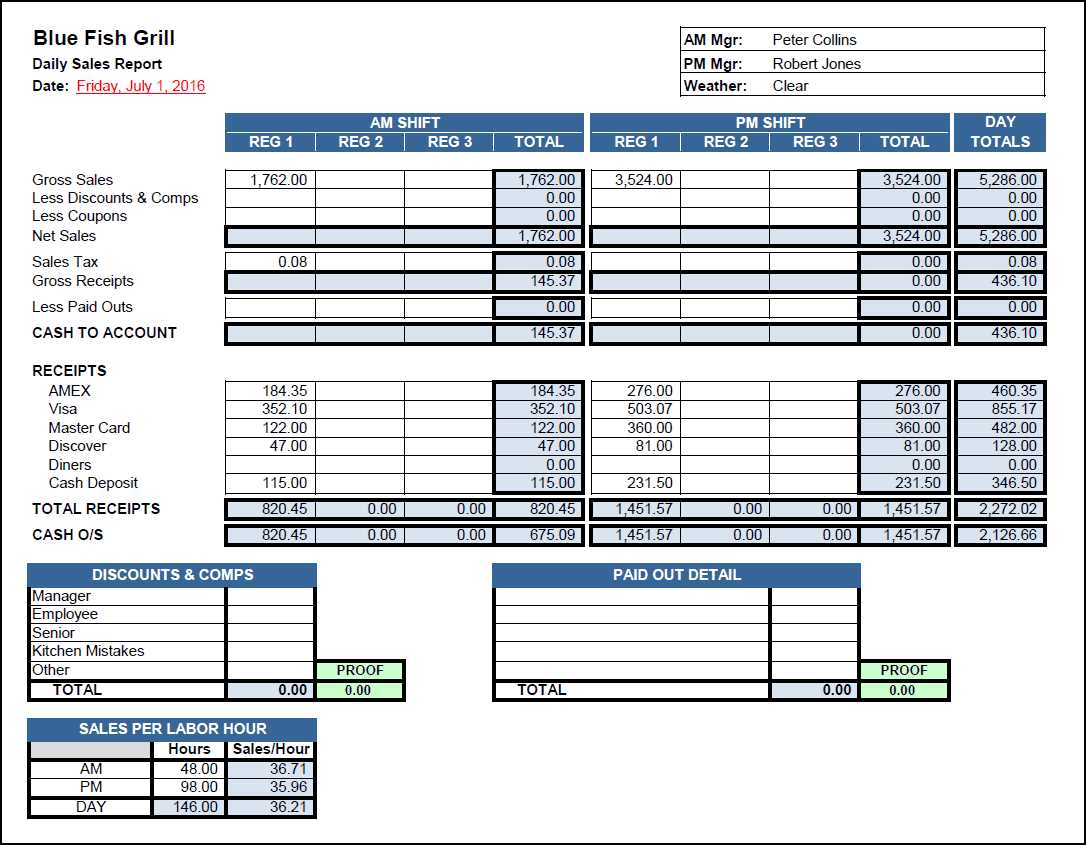
Apply SUM functions to total gross receipts instantly. Use conditional formatting to highlight discrepancies and identify missing data. Set up percentage formulas to compare revenue trends across different periods.
Enhance clarity with visual elements
Integrate bar charts or line graphs to illustrate income patterns. Utilize data validation to prevent entry errors and maintain consistency. Keep formatting clean with alternating row colors for better readability.
Data Fields Included in the Template
Ensure accurate financial tracking by filling in each required field. The template organizes revenue details into structured categories, making analysis straightforward.
Revenue Breakdown
List income sources separately for a clear overview. Key fields include:
- Date: The transaction date for proper period allocation.
- Invoice Number: A unique identifier for cross-referencing.
- Customer Name: Identifies the source of income.
- Revenue Category: Classifies earnings (e.g., product sales, services).
- Amount: The gross receipt total before deductions.
Adjustments and Totals
Summarize figures effectively with these essential fields:
- Discounts: Record reductions applied to sales.
- Taxes Collected: Separates taxable income for compliance.
- Net Receipts: Automatically calculated after deductions.
With these fields properly completed, the template provides a reliable snapshot of financial performance, helping with accurate reporting and planning.
Automating Calculations for Total Revenue
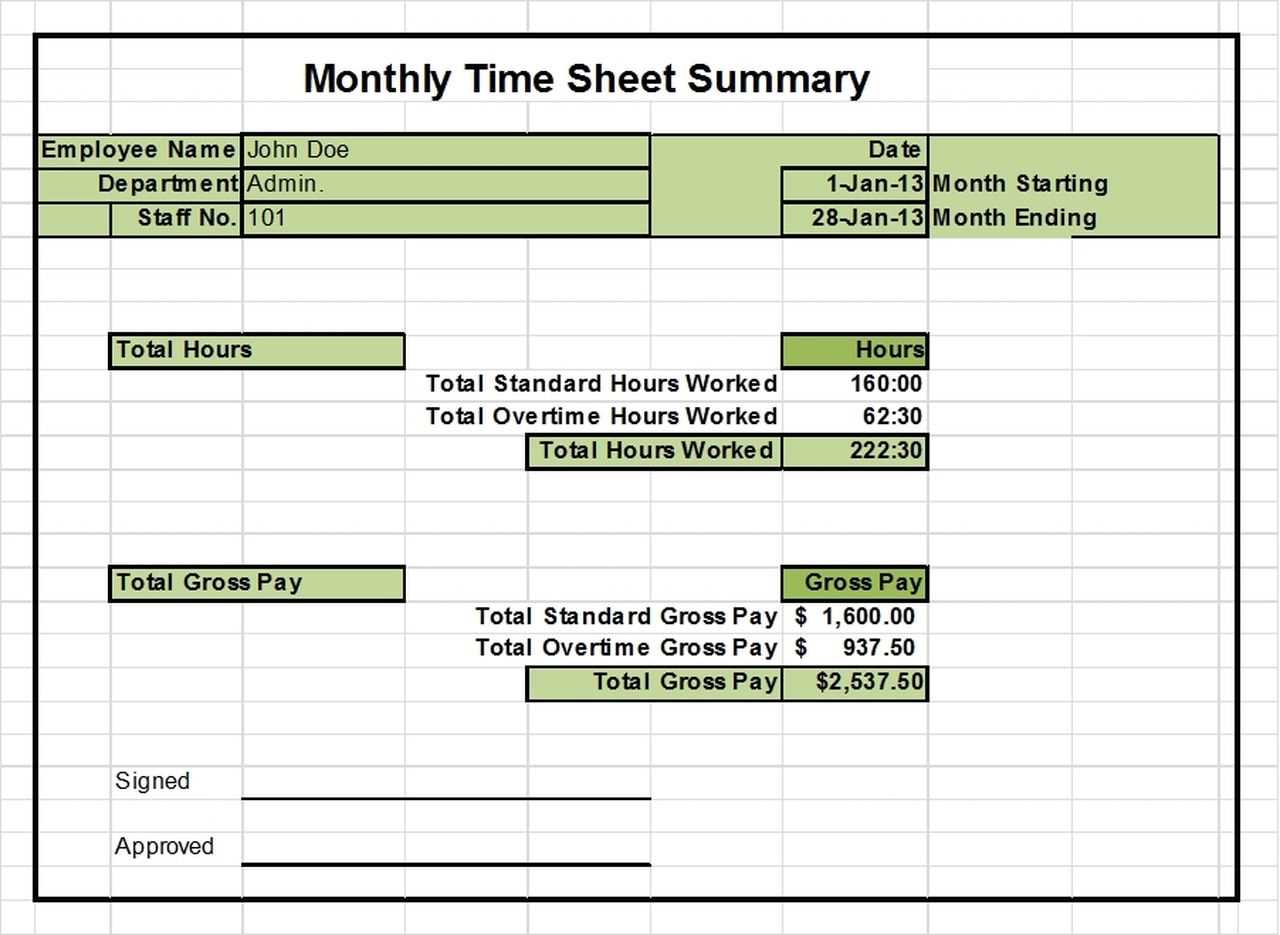
Use Excel formulas to streamline revenue tracking. The SUM function quickly adds up sales figures, while SUMIF or SUMIFS help filter amounts based on categories like product type or date.
Set Up Dynamic Revenue Calculation
Organize data with a structured table where each row represents a transaction and columns include date, amount, and category. Reference these values in a dedicated summary section using SUM functions linked to named ranges for clarity.
Automate with Pivot Tables
Insert a pivot table to generate revenue summaries without manual entry. Drag the sales amount field into the values section and apply automatic filters for quick adjustments. Enable automatic updates by refreshing the pivot table when new data is added.
For a fully automated approach, combine pivot tables with macros. Record a macro that refreshes data and applies calculations with a single click, ensuring up-to-date revenue tracking at all times.
Customizing Categories for Different Income Sources
Organize your income sources by creating specific categories that reflect your business model. Use clear labels that help track revenue streams efficiently. Avoid vague names–opt for precise terms like Product Sales, Consulting Fees, or Rental Income.
Grouping Income for Better Analysis
- Service-Based Income: Break down earnings from different client types or service tiers.
- Product Sales: Categorize by product lines, seasonal items, or wholesale vs. retail.
- Passive Revenue: Include royalties, affiliate commissions, or dividends separately.
Using Excel for Customization
Adjust category names in your template to match your revenue sources. Follow these steps:
- Open the Income Summary sheet.
- Locate the Category column.
- Rename default labels to fit your business needs.
- Ensure formulas reference the updated names correctly.
Refining categories enhances financial insights, helping identify growth areas and optimize revenue strategies.
Importing and Exporting Data for Reporting
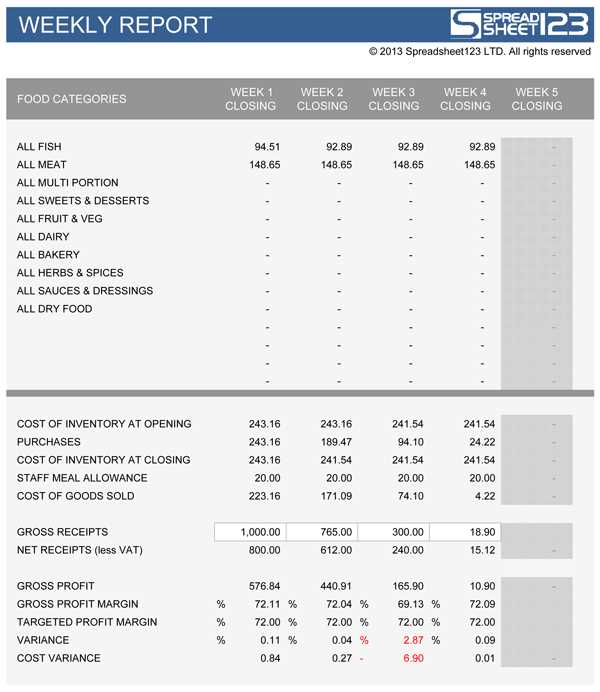
Use the “Get External Data” feature in Excel to import revenue details from CSV, TXT, or database files. Select Data > Get Data, choose the file type, and follow the prompts to load structured records into your template.
For automated updates, link external sources via Power Query. This ensures the latest figures are always reflected in your reports without manual entry.
When exporting, save reports in multiple formats. Choose File > Save As and select CSV for compatibility or PDF for finalized summaries.
| Action | Steps |
|---|---|
| Import from CSV | Data > Get Data > From File > From Text/CSV |
| Import from Database | Data > Get Data > From Database > Select Source |
| Export to PDF | File > Save As > Choose PDF |
| Automate with Power Query | Data > Queries & Connections > Refresh |
For large datasets, use PivotTables to summarize transactions efficiently before exporting. This reduces file size while keeping key insights intact.
Using Conditional Formatting for Quick Insights
Highlight key financial trends by applying conditional formatting to your gross receipts data. Use color scales, icon sets, and data bars to visually emphasize revenue changes and spot anomalies instantly.
Applying Color Scales
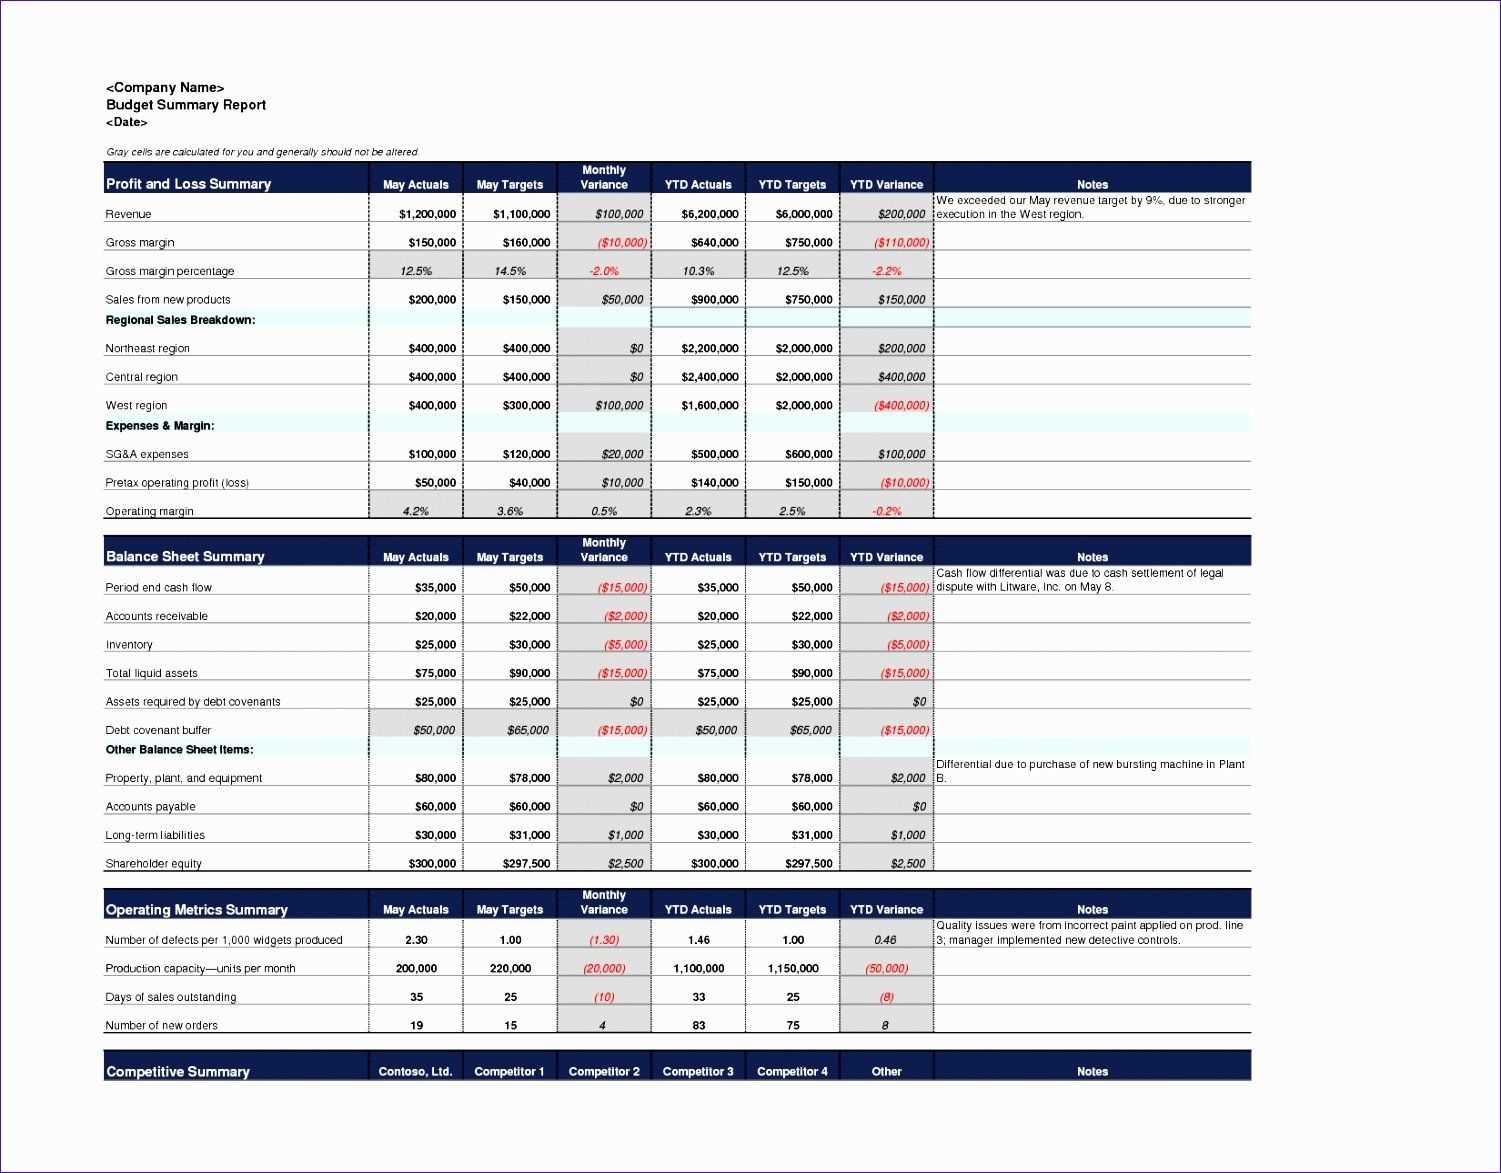
- Select the revenue column.
- Go to Home > Conditional Formatting > Color Scales.
- Choose a gradient that clearly differentiates high and low values.
This method makes it easy to identify peak earnings and downturns at a glance.
Using Icon Sets for Trends
- Navigate to Conditional Formatting > Icon Sets.
- Select an icon style, such as arrows or traffic lights.
- Adjust thresholds under Manage Rules for better accuracy.
Icons instantly show whether revenue is rising, stable, or declining, making comparisons effortless.
Refining these rules ensures clearer insights without unnecessary clutter.
Common Errors and Troubleshooting Methods
Ensure your formulas are correctly applied. A common mistake is using absolute references when relative references are needed, or vice versa. This can result in incorrect calculations when you copy formulas across rows or columns. Check if your cell references are locked when they should be dynamic.
If you encounter inaccurate totals, verify that all data cells are correctly formatted as numbers. Sometimes text values can be mistakenly entered, which will prevent calculations from working properly. Double-check that no spaces or non-numeric characters are in the input fields.
When the template seems unresponsive or slow, it might be due to too many calculations running simultaneously. Try breaking your data into smaller sections or using manual calculation mode to improve performance. You can access this option under Excel’s “Formulas” tab.
If your template isn’t saving correctly, make sure you are not exceeding Excel’s file size limit. Large data sets with numerous formulas can cause the file to become too large for proper saving. Consider simplifying or archiving older data to avoid this issue.
In cases of missing or incorrect data, check your source file paths and links to external files. Broken links can cause incomplete data to appear in your summary, leading to discrepancies. If using external sources, ensure they are properly linked and accessible.
